An Animated Introduction to the Discrete Wavelet Transform
An Animated Introduction to the Discrete Wavelet Transform
Arne Jensen
Aalborg University
A signal with 8 samples:
56, 40, 8, 24, 48, 48, 40, 16
| 56 | 40 | 8 | 24 | 48 | 48 | 40 | 16 | ||||||||||||||
| 48 | 16 | 48 | 28 | 8 | -8 | 0 | 12 | ||||||||||||||
| 32 | 38 | 16 | 10 | ||||||||||||||||||
| 35 | -3 |
The first row is the original signal- The next row is composed of
- the mean of samples pairwise
(56 + 40)/2 = 48
(56 - 48) = 8
The transform is invertible.
left = mean + difference
left + right = 2 * mean
left - mean = difference
right = mean - difference
Now, we consider to do the threshold filtering about the difference values calculated then re-construct the signal:
- threshold = 4
- threshold = 9
| 59 | 43 | 11 | 27 | 45 | 45 | 37 | 13 | ||||||||||||||
| 51 | 19 | 45 | 25 | 8 | -8 | 0 | 12 | ||||||||||||||
| 35 | 35 | 16 | 10 | ||||||||||||||||||
| 35 | 0 |
| 51 | 51 | 19 | 19 | 45 | 45 | 37 | 13 | ||||||||||||||
| 51 | 19 | 45 | 25 | 0 | 0 | 0 | 12 | ||||||||||||||
| 35 | 35 | 16 | 10 | ||||||||||||||||||
| 35 | 0 |
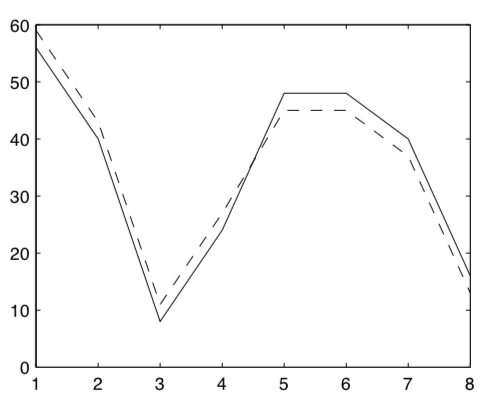
Solid line: original signal
Dashed line for thresholding
| threshold = 4 | threshold = 9 |
|---|---|
 |  |

留言